Research & Planning
Contact Us
Research & Planning
4000 Suisun Valley Road
Building 600
Fairfield, CA 94534
research.helpdesk@solano.edu
Research & Planning
To make a request for data or dashboard creation, please email Research.Helpdesk@solano.edu with a description of what you will need and roughly when you will need it. A member of our team will then be able to reach out to you to cover timelines and additional information. Please submit your request at least two weeks prior to the date the data are needed. Please be aware that some data requests may take longer, so feel free to submit the ticket as early as you identify the need.
For emergency requests, please include the word “Emergency” in the subject of your email, and we will evaluate the process under an expedited timeline.
Our online interactive factbook contains demographic, student success, distance education and graduation data. The data can be filtered on a number of academic and student dimensions. See "How to use the Online Interactive Factbook" below.

Navigate the interactive data sets by selecting and clicking to open one of the tabs listed in the interactive workbook.
The options are: Demographics, Student AcAdemics, Student Location, Student Success, Student Success XTab, Distance Education, Awards, and Graduate Map.
DEMOGRAPHICS
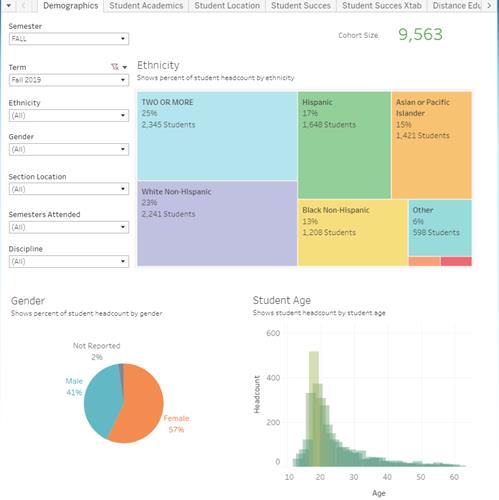
This dashboard shows basic demographic information about a specific student cohort selected using the filters on the left-hand side. The filters available are:
- Semester
- Term
- Ethnicity
- Gender
- Section Location
- Semesters Attended
- Discipline
STUDENT ACADEMICS
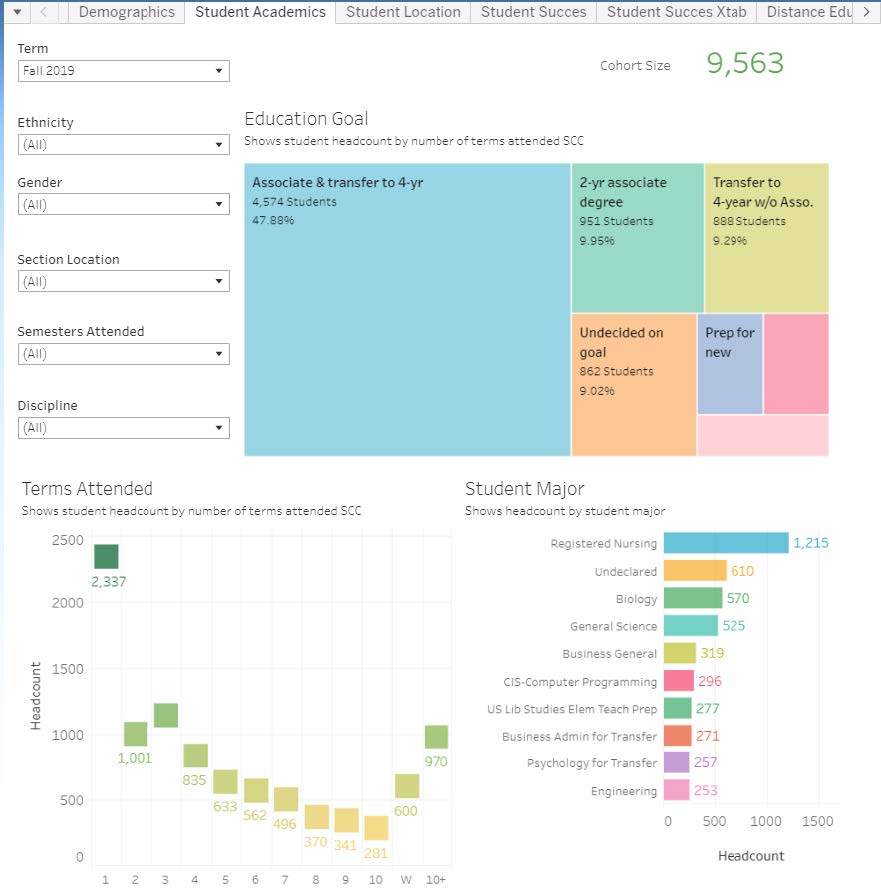
This dashboard shows a variety of data related to a student’s academic standing and goals.
STUDENT LOCATION
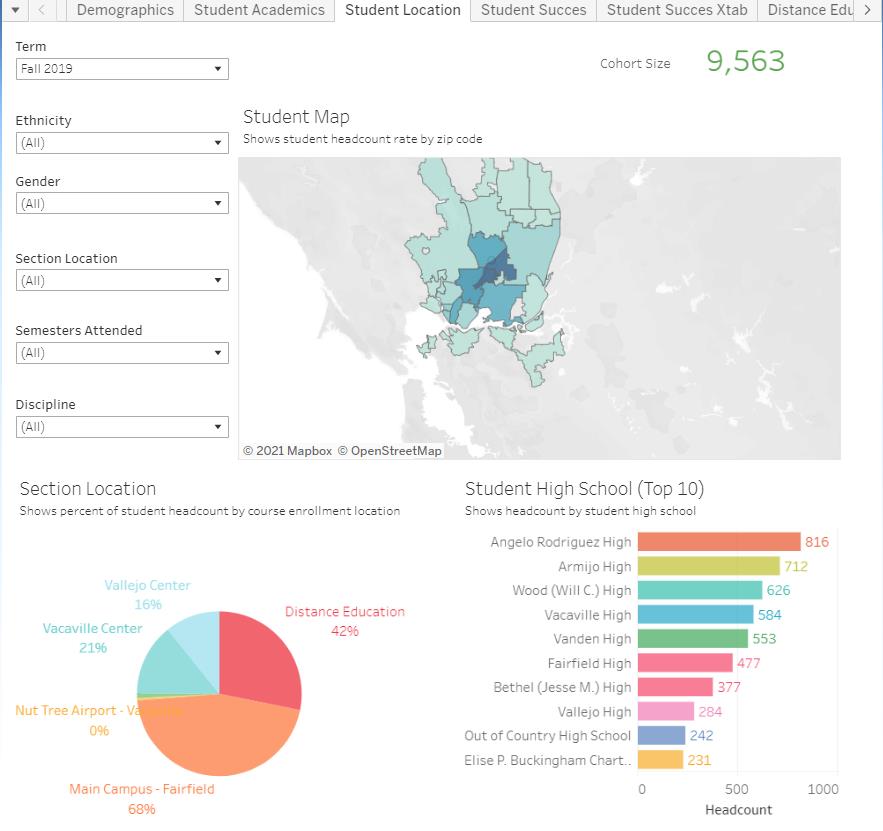
This dashboard shows information about students by location. This includes a map based on zip code, section location for enrolled courses as well as high school.
STUDENT SUCCESS
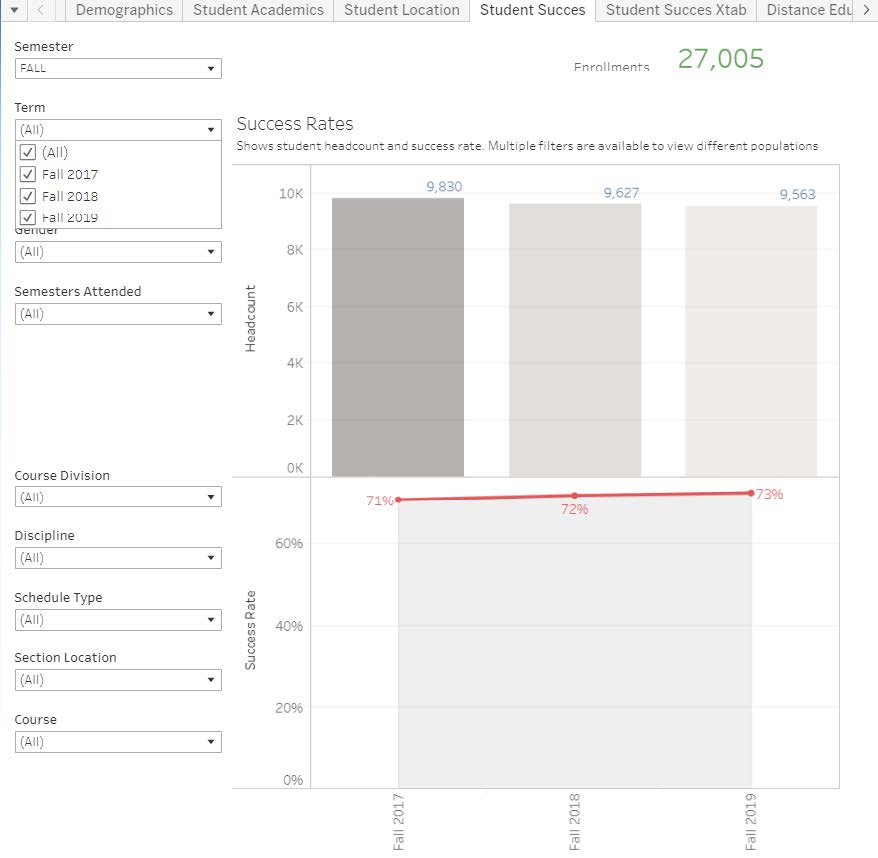
This dashboard is used to display student headcounts and success rates over time for the selected cohort. A number of filters can be applied to narrow down the cohort. These include:
- Semester
- Term
- Ethnicity
- Gender
- Number of Semesters Attended
- Course Division
- Discipline
- Schedule Type
- Section Location
- Course
The upper chart simply shows the headcount of the selected cohort. The lower chart shows the success rate as a red line. The grey area shows the institution average success rate to use as a comparison.
STUDENT SUCCESS XTab
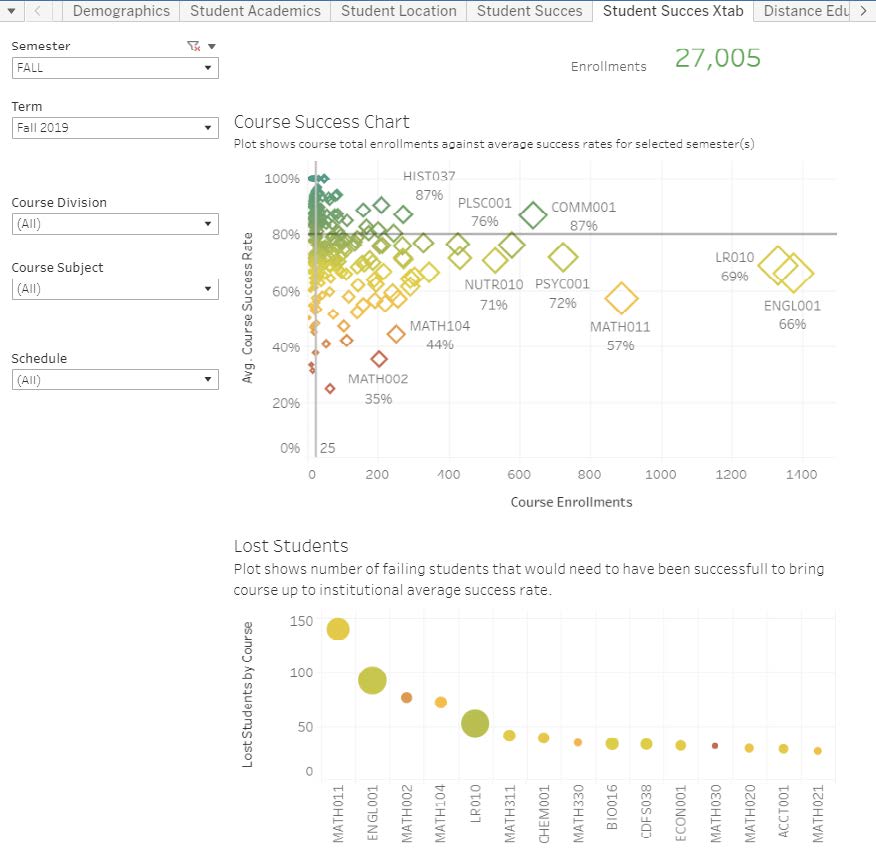
The student success crosstab is used to quickly identify courses that have high enrollments but low success rates. The horizontal axis shows the number of enrollments in the course, the vertical axis shows the average success rate.
The lower chart shows the number of students that have been ‘lost’. This is defined as the number of students that would need to be successful in order for the course to have a success rate at the institution average. This combines the two measurements of enrollment and success rate into a single measure.
The 2 dashboards can be filtered by:
- Semester
- Term
- Course Division
- Course Subject
- Schedule
DISTANCE EDUCATION
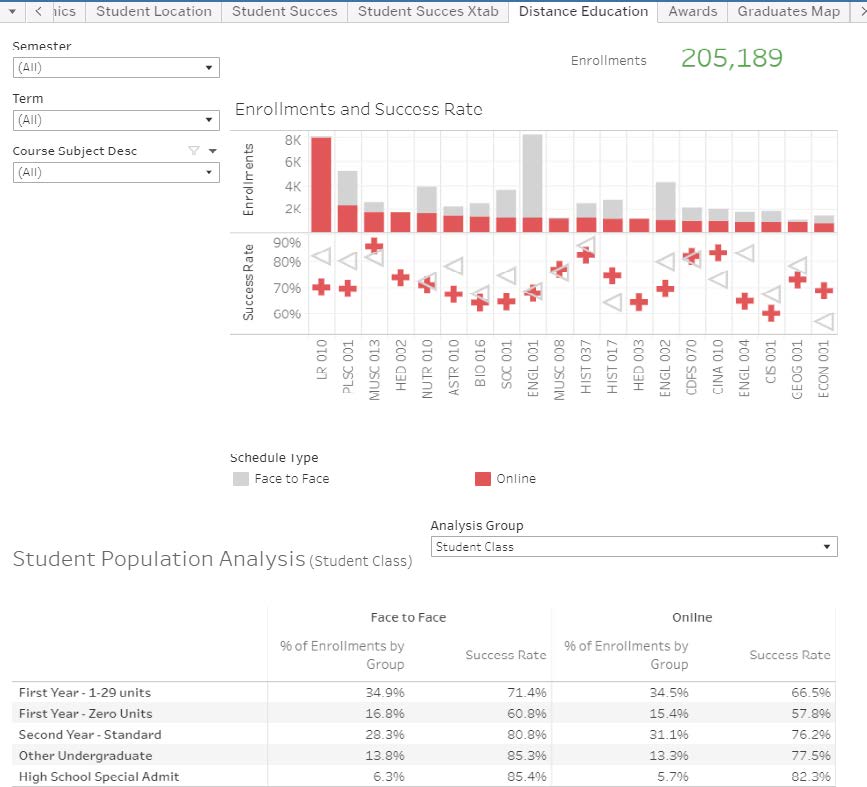
This dashboard is used to look at and compare enrollments and success rates in distance education courses. The overall selection for this view is all courses that have an online component with at least 5 students enrolled. Only the top 20 courses (by distance education enrollments) will be displayed.
The charts can be filtered by:
- Semester
- Term
- Discipline
AWARDS
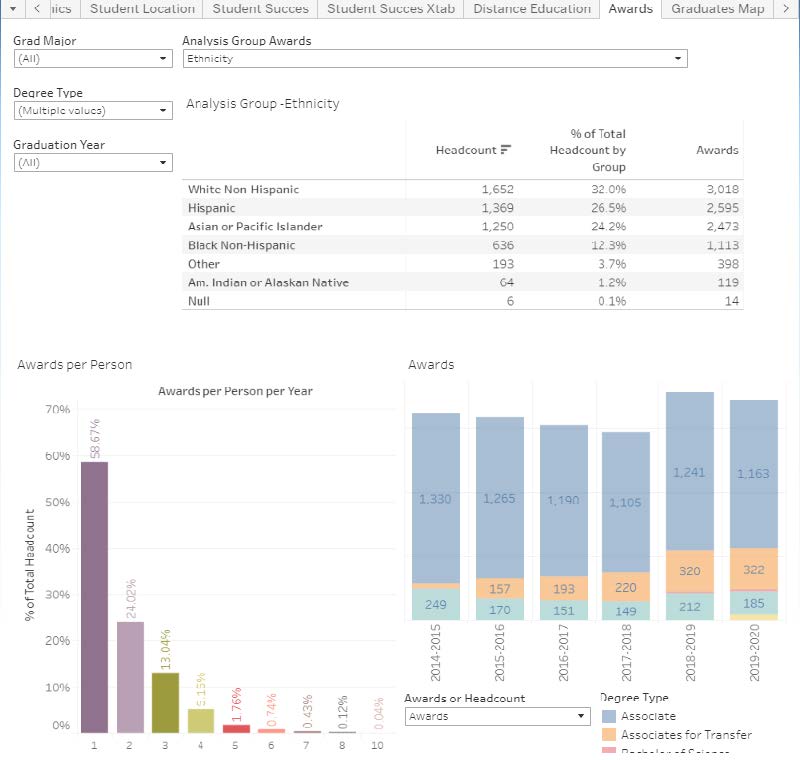
This dashboard shows information related to awards given to students. The user can filter the date by:
- Graduating Major
- Degree Type
- Graduation Year
Additionally, you can view an analysis group to split the data by:
- Ethnicity
- First generation
- Gender
- Transfer Students
- Veteran
- Economically disadvantaged
GRADUATE MAP
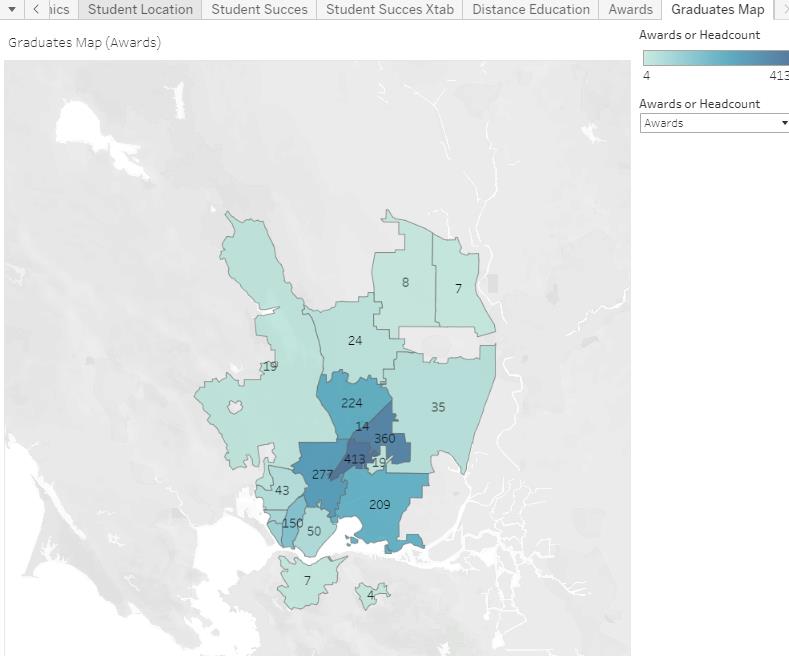
This dashboard shows information about awarded graduates by location.
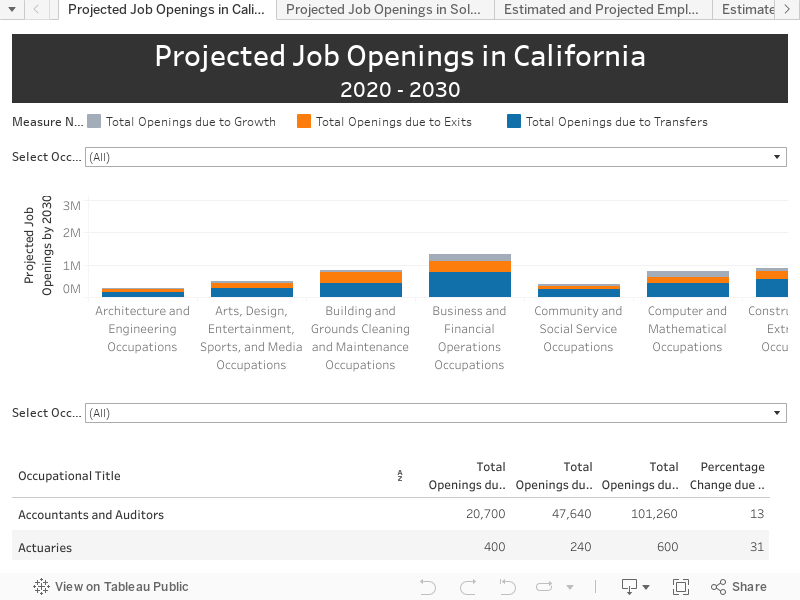
This worksheet contains Labor Market data for Solano County and California. Includes wage, openings and job growth data by occupation. Source: https://data.ca.gov/dataset/long-term-occupational-employment-projections
The Chancellor’s Office of the California Community College System collects enrollment, demographic, and other student data from all its constituent institutions within 30 days after the end of each term. These data may be accessed via the Management Information System (MIS) Data Mart at the college, district, and statewide levels by term and academic year. The Data Mart contains several pre-defined reports that are available to the public. It allows for the easy development of these reports, and the download of aggregate data in comma-delimited files for analysis and longitudinal tracking. Usually one or more criteria (for example: student age category, gender, enrollment status, ethnicity, or instructional discipline) can be used to group the output data on the reports.
Select the Queries option to access Students, Courses, Student Services, Outcomes and Faculty & Staff information
The Integrated Postsecondary Education Data System (IPEDS) is sponsored by the National Center for Educational Statistics (NCES), a unit under the federal Department of Education. The College is a recipient of federal funds and, as such, is required to submit annual reports to IPEDS. One of the outcomes is a custom report from IPEDS comparing metrics from Solano Community College with the median of similar select institutions.
[IPEDS REPORT2022 TO BE EMBEDDED HERE - PLEASE CHECK BACK SOON]